Owner Dashboard — what each number means, and exporting to Excel
Owner Dashboard — what each number means, and exporting to Excel
This article explains exactly how each Owner Dashboard number is calculated, so owners, managers and accountants read them the same way, and how the Excel export is laid out.
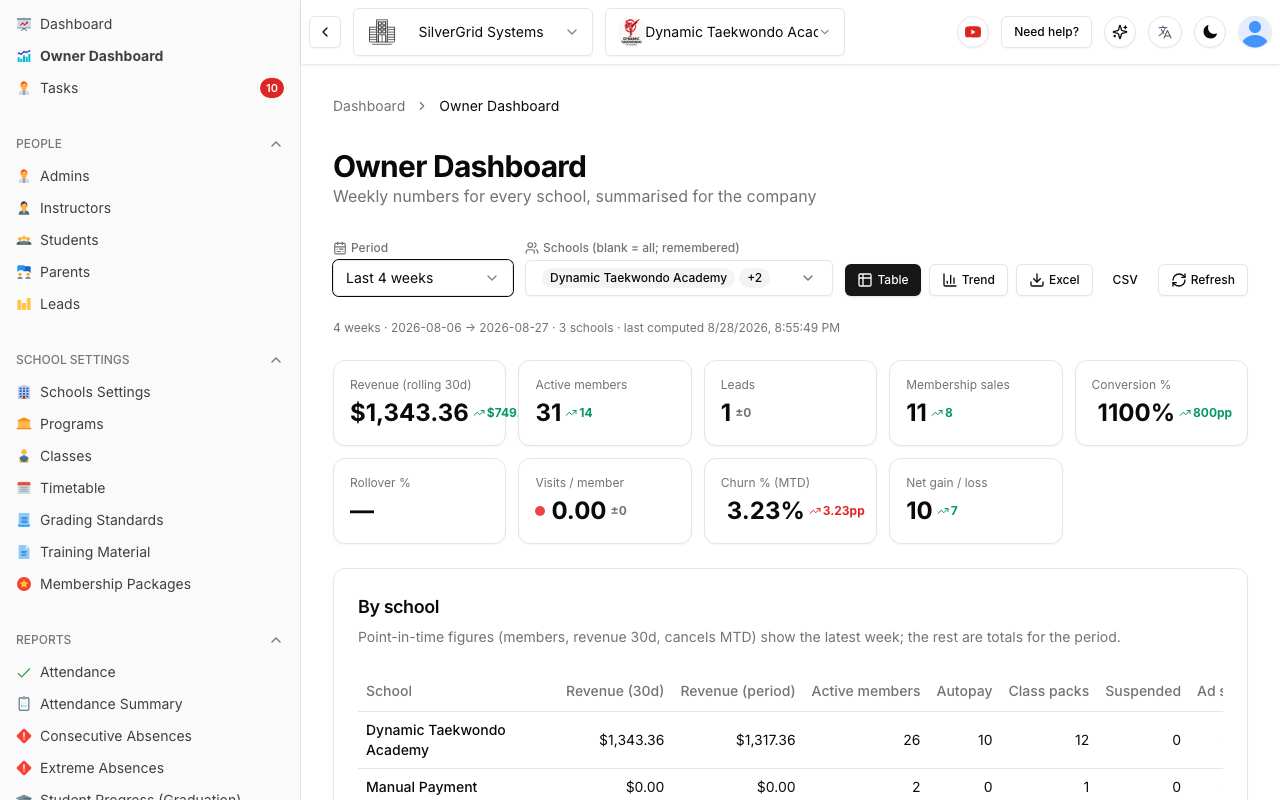
Members & revenue
| Metric | How it is calculated |
|---|---|
| Revenue (30d) | Payments received in the 30 days up to the end of the week — cash basis, any payment method. |
| Revenue (period) | Payments received inside the selected period. |
| Active members | Students who were active during the week (same rule as the Membership Health KPIs). |
| Autopay | Live memberships collected automatically through Stripe or Topiic. |
| Class packs | Live memberships on packages with a fixed number of classes. |
| Suspended | Students currently on hold. |
1. Lead generation
- Ad spend — from the school's Marketing tab for that week.
- Paid leads — the paid-lead count entered on the Marketing tab; if left at 0, leads recorded with a paid source (Meta / Google / other ad).
- Organic leads — all other leads created in the week.
- Cost / lead — ad spend ÷ paid leads.
2. Sales
- Intro + pack sales — new students whose first membership, started this week, is an introductory / trial package.
- Membership sales — new students whose first membership, started this week, is a regular package. Package changes, renewals and trial-to-member rollovers are not sales.
- Conversion % (target 30%) — (intro + membership sales) ÷ leads created in the period.
- Sales value — the membership rate of those new memberships.
3. Trial to member
- Rollovers — students whose introductory offer started 14 days before the week (so it ends this week) and who started a regular membership within 14 days after it.
- Rollover % (target 80%) — rollovers ÷ the number of intros in that cohort.
4. Engagement
- Attendance — check-ins marked present in the week.
- Visits / member (target 3–4) — attendance ÷ active members (average per week when a longer period is selected).
5. Churn
- Cancels — students set to inactive during the week. Cancels MTD — the same, from the 1st of the month the week starts in.
- Churn % (target under 5%) — cancels MTD ÷ active members.
Growth
Net gain / loss = membership sales + rollovers − cancels for the week.
Totals and periods
Company totals add up the counts and amounts of the selected schools and then recalculate the percentages from those totals — percentages are never averaged. When you select more than one week, counts and amounts are summed and point-in-time figures (members, revenue 30d, cancels MTD) show the latest week. A dash (—) means the number cannot be calculated (for example no leads, so no conversion rate) or that week has not been calculated yet — press Refresh.
Exporting to Excel
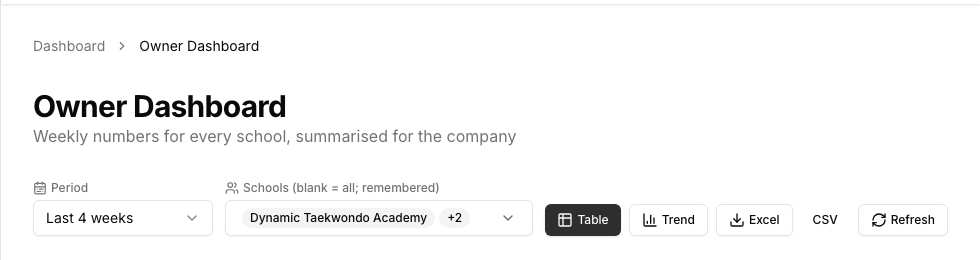
Excel downloads a workbook in the familiar weekly-sheet layout for the selected schools and period:
- Summary — the company totals, one column per reporting week, rows in the sheet's order (Rolling 30 day Revenue, Autopay Member #, Class Packs, Suspended, 1. LEAD GEN …, Net Gain or loss) plus a few SSM extras (active members, weekly revenue, total leads, intro cohort);
- one sheet per school with the same rows;
- Period — the by-school table exactly as shown on screen;
- Marketing — every spend entry; and Notes — these definitions.
Percentages are real Excel percentages (formatted with %), amounts are numbers, so you can add your own formulas. CSV gives one line per school per week with every metric, for your own analysis tools.
Related articles
- Owner Dashboard — see every school's weekly numbers in one place
- Owner Dashboard — setup: reporting week, marketing spend, intro offers and lead sources
Learn more at www.sportsschoolmanager.com · More video tutorials on our YouTube channel.