Owner Dashboard — see every school's weekly numbers in one place
Owner Dashboard — see every school's weekly numbers in one place
The Owner Dashboard gives company owners one screen with the weekly scoreboard for every school — revenue, members, leads, sales, trial rollovers, attendance, cancellations and net growth — summarised for the whole company and broken down by school. It replaces the weekly numbers each dojo used to send in by email or spreadsheet.
Who can see it: company owners only (the people listed under Company → Owners). School admins do not see this menu item.
Step 1 — Open the Owner Dashboard
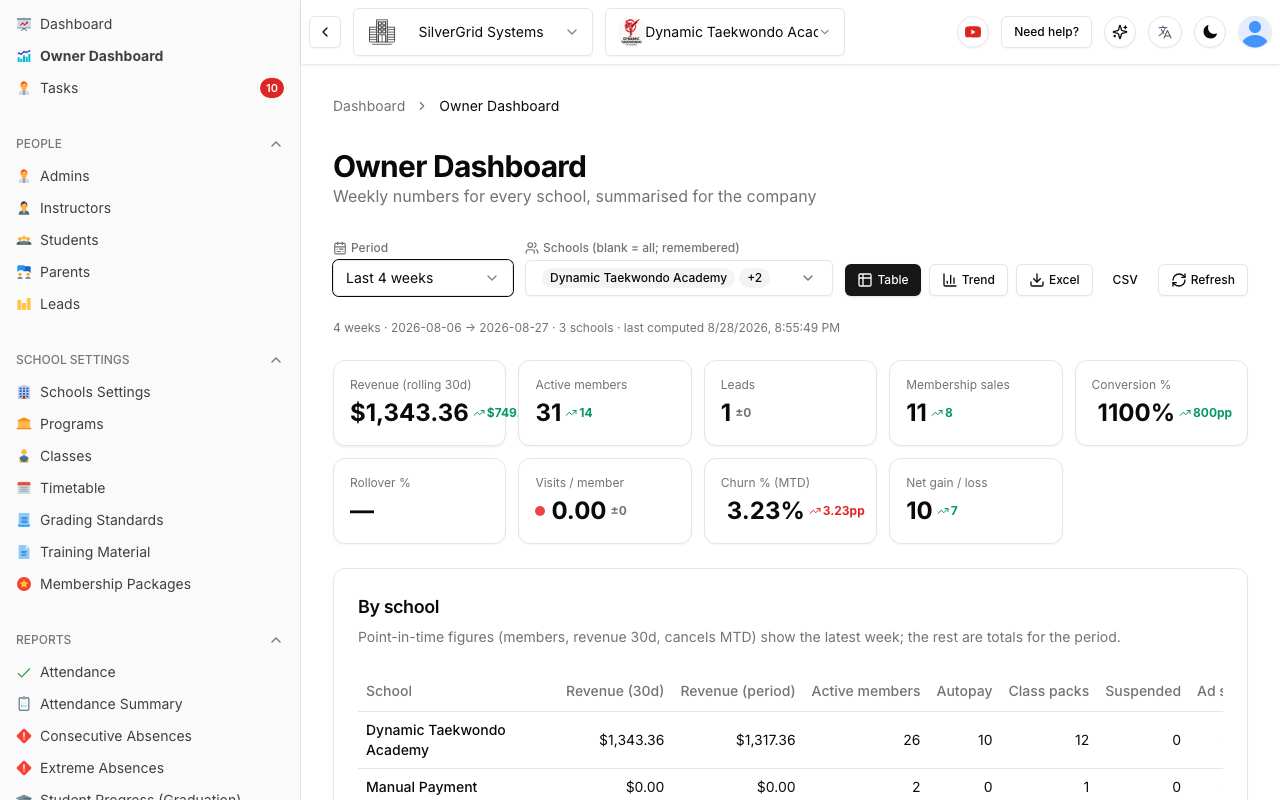
In the left sidebar, directly under Dashboard, click Owner Dashboard. The page shows the company you have selected in the top bar. If you own more than one company, switch companies with the company selector first.
Step 2 — Choose the period
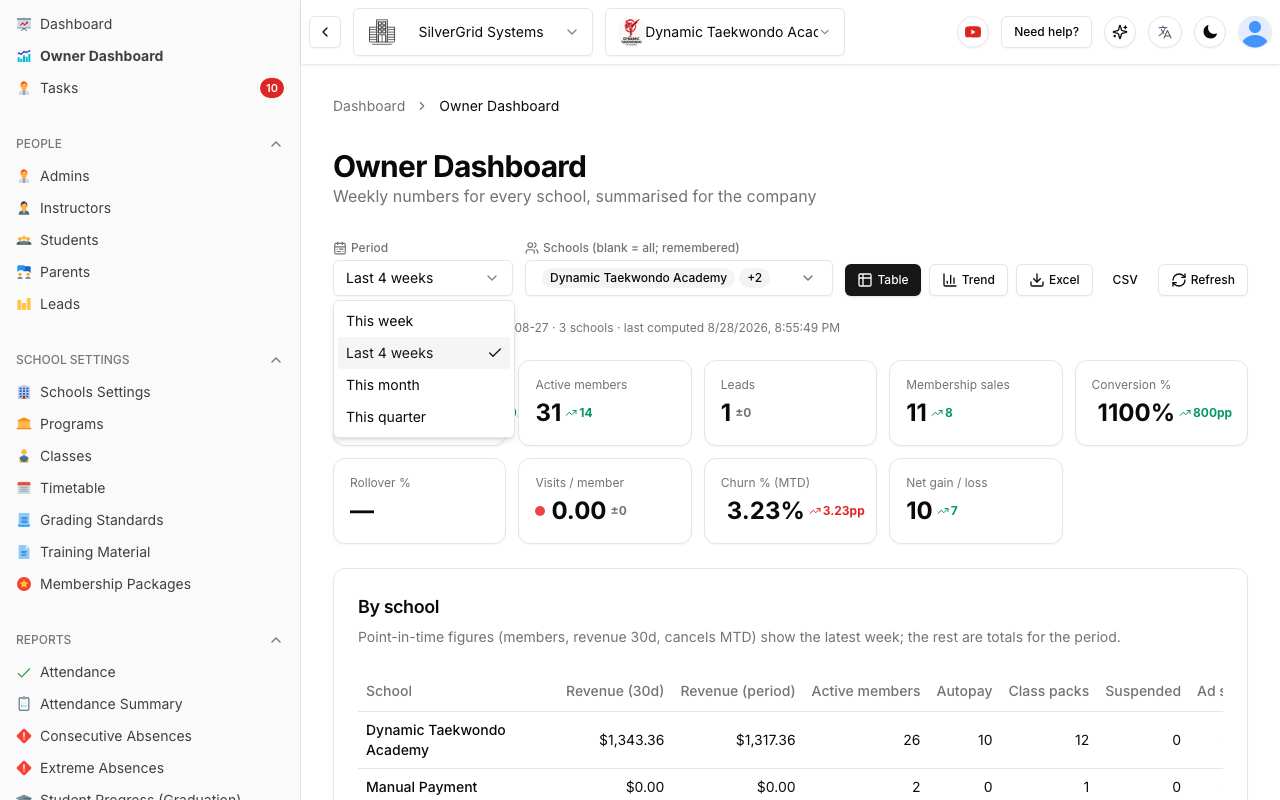
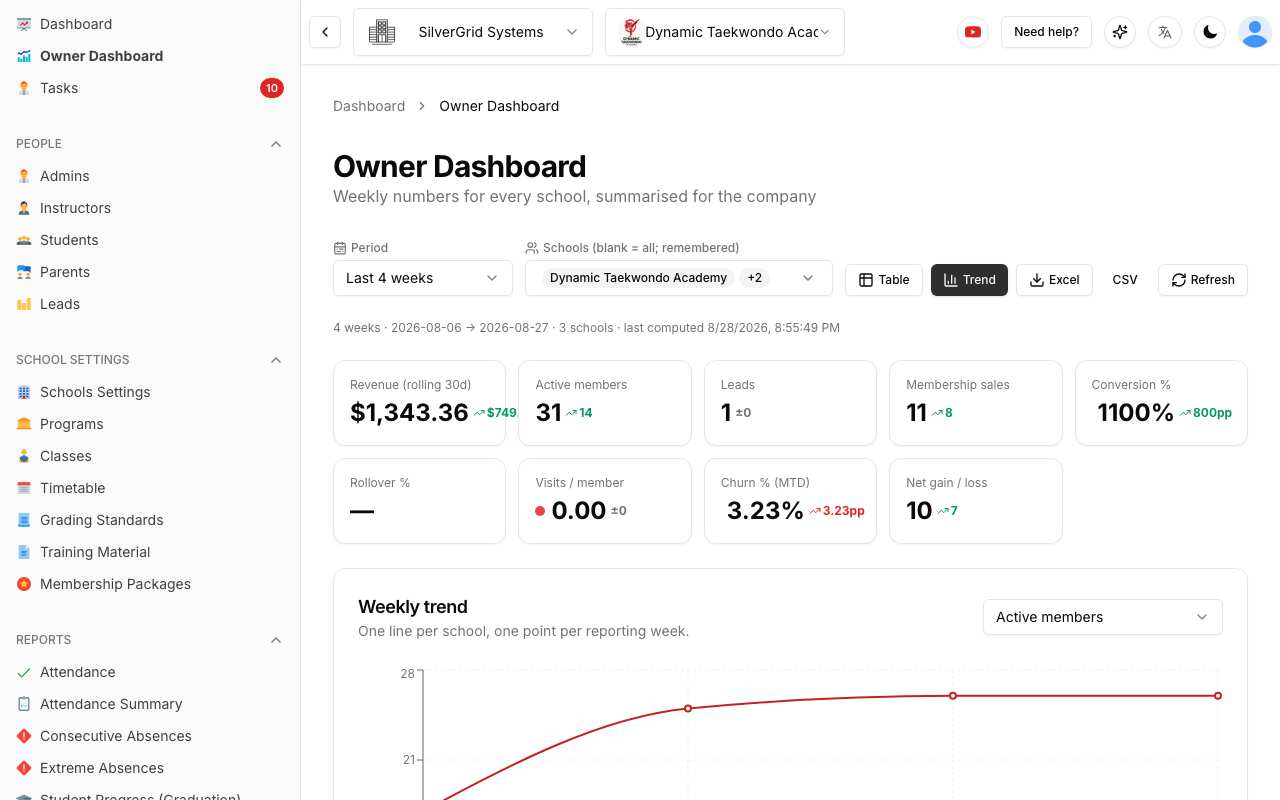
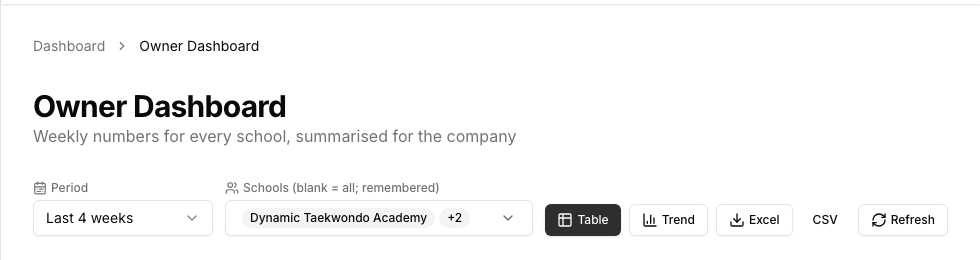
Use the Period selector to look at This week, Last 4 weeks, This month or This quarter. Periods are made of reporting weeks — 7-day weeks that start on the weekday set in your company settings (Thursday by default; see the setup article). The line under the toolbar tells you exactly which dates are covered and how many schools are included.
Step 3 — Pick the schools
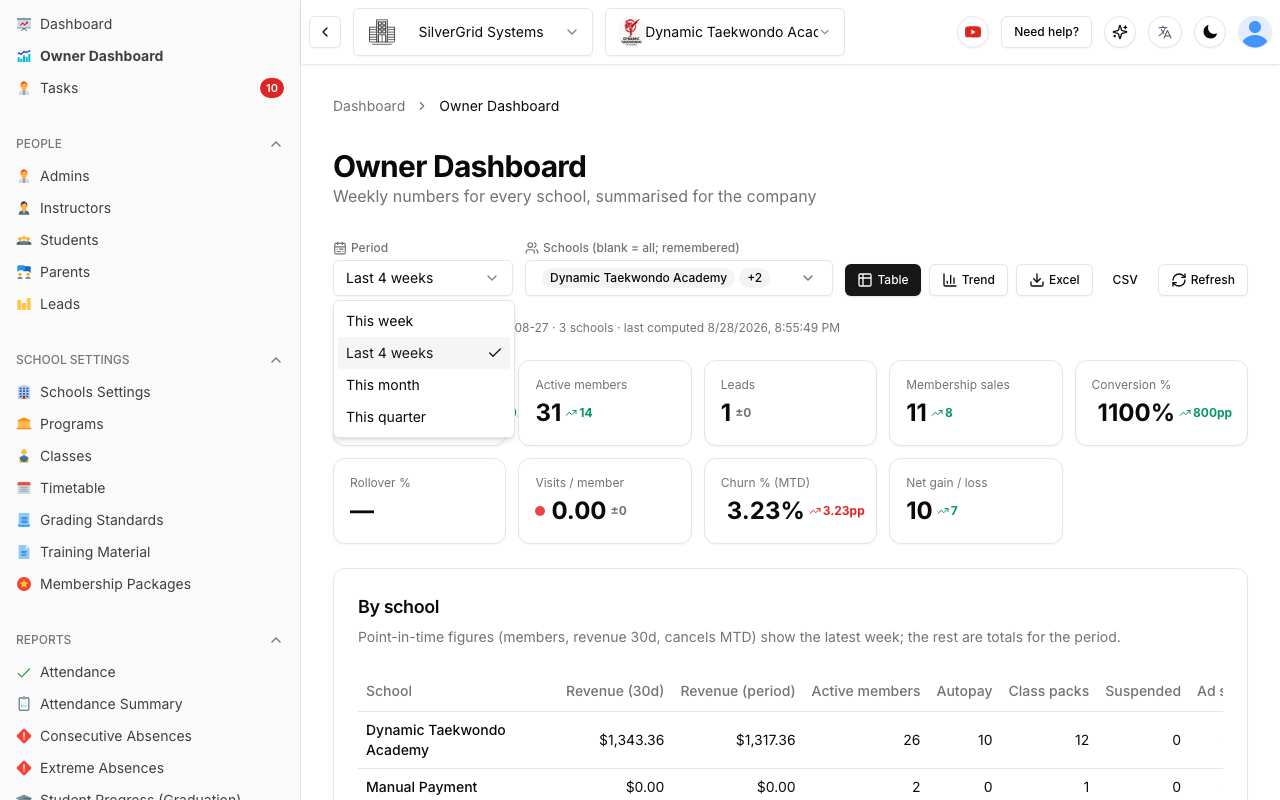
Click the Schools box to tick the schools you want to compare. Leave it blank to see all schools. Your selection is remembered — the next time you open the dashboard it shows the same schools and period.
Step 4 — Read the summary tiles
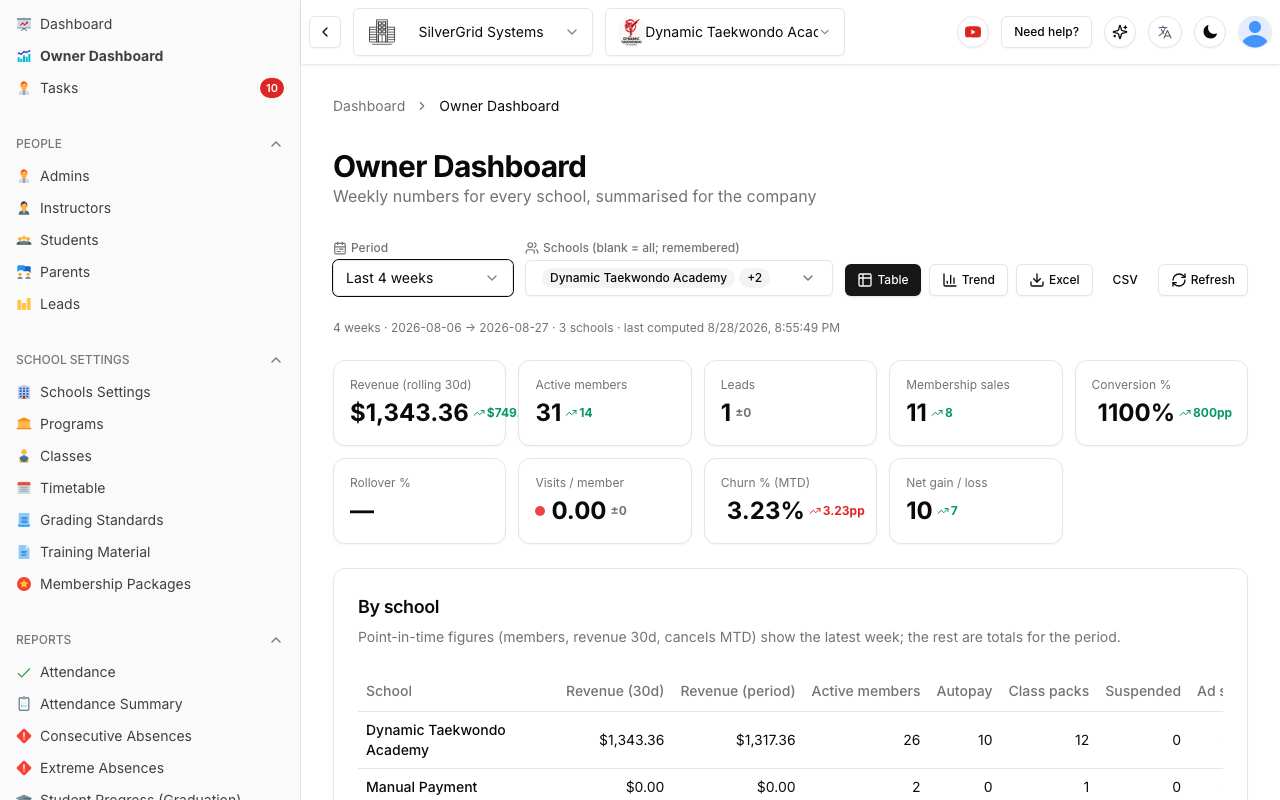
The tiles are the company totals for the chosen schools and period. Each tile shows:
- the value for the period,
- a small change versus the previous period of the same length (green = better, red = worse — for churn, lower is better),
- a traffic light on the four KPI tiles: ● on target, ● within 10% of target, ● off target. The targets are the industry benchmarks from the weekly sheet: Conversion 30%, Rollover 80%, Visits per member 3–4, Churn under 5%.
Conversion above 100%? That happens when people joined without first being recorded as a lead in SSM. Record enquiries as leads (or use the lead source on your enquiry links) and the number becomes meaningful.
Step 5 — Compare schools in the table
The By school table has one row per school and a Total row, with the columns in the same order as the weekly sheet: revenue → members → lead generation → sales → trial-to-member → engagement → churn → growth. Scroll sideways to see every column. Counts and amounts are totals for the period; point-in-time figures (active members, autopay members, revenue for the last 30 days, cancels month-to-date) show the latest week.
Step 6 — Watch the trend
Click Trend to switch to a chart with one line per school and one point per reporting week. Choose any metric in the drop-down on the right — for example Active members to see growth, or Cancels to spot a problem early.
Step 7 — Refresh and export
The numbers are calculated automatically every night. Press Refresh to recalculate the current week and the previous eight weeks right now (for example after entering marketing spend or back-dating a payment). Excel downloads the accountant's weekly sheet — a summary plus one sheet per school — and CSV downloads the raw numbers.
Related articles
- Owner Dashboard — setup: reporting week, marketing spend, intro offers and lead sources
- Owner Dashboard — what each number means, and exporting to Excel
Learn more at www.sportsschoolmanager.com · More video tutorials on our YouTube channel.